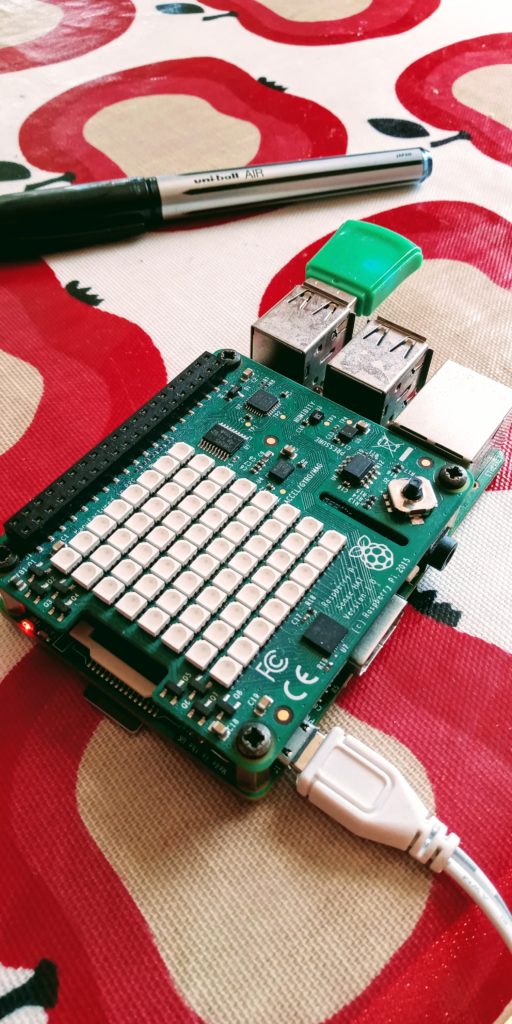
Easy as PI Weather Station – putting it all together

Sorry it has taken me so long to continue with this series. There were little things that got in the way such as C*****19, and going through redundancy but lets put those little things aside and recap. Last time we created a web service using node Express which will be used to capture environmental data from our Raspberry PI Sense Hat.

In this article we are going to hook things up by sending the data collected from the Raspberry PI, to our web service. We will also be updating our endpoints to handle the data correctly. Let’s get started!

First of all open the collector.py file.

We are going to POST the data to our web service endpoint. Find the line where we are checking if we have reached the interval and replace it with the code shown here.

if minute_count == MEASUREMENT_INTERVAL:                                                                                 
    # Create the payload object                                                                                          
    payload = {                                                                                                              
    'date':dt.strftime("%Y/%m/%d %H:%M:%S"),                                                                             
    'temperature':round(temp_c,2),                                                                                       
    'pressure':round(sense.get_pressure(),2),                                                                            
    'humidity':round(sense.get_humidity(),2),                                                                        
    }                                                                                                                     
    data = urllib.urlencode(payload)                                                                                     
    request = urllib2.Request(END_POINT,data)                                                                            
    response = urllib2.urlopen(request).read()                                                                           
    print(payload)                                                                                           
    minute_count = 0;   

We are using a couple of Python libraries called urllib and urllib2 to do the heavy lifting of encoding our payload and sending it across to our Node.js server.

All that is left is to add the new endpoint to our Node.js server to process the request and update the list to return an actual list of weather data. Exciting eh! Open up another terminal session and navigate to the server directory. Using your editor of choice open up the index.js file.

Update the endpoints as shown below.

// Provide service meta data
app.get('/api/environment/meta', (req,res) => {
    res.header("Access-Control-Allow-Origin", "*");
    res.send({
        averageTemp:averageTemp,
        count:data.length,
        lastEntry:lastEntry
    } );
} );

// List all entries
app.get('/api/environment/entries', (req,res) => {
    res.header("Access-Control-Allow-Origin", "*");
    res.send(data);
} );

app.post('/api/environment', (req,res) => {
    if (!isValid(req.body)) {
        res.status(400).send('Invalid request, required fields missing.');
        return;
    }
    const count = data.length + 1;
    const entry = {
        id:count,
        date:req.body.date,
        temperature:req.body.temperature,
        pressure:req.body.pressure,
        humidity:req.body.humidity
    }
    lastEntry = entry;
    total += parseFloat(req.body.temperature);
    averageTemp = total / count;
    data.push(entry);
    res.json(entry);
} );

You may recall last time we added a dummy /api/environment/entries endpoint which simply returned an empty array.

Let’s flesh this out. The endpoint is defined as a POST method which means data is sent as part of the body of the request. We validate that we do indeed have a body then update the count metric. We then build a JSON object by pulling out the parts of the request we are interested in. Finally we update the lastEntry variable, work out the average temperature to date before updating our list.

With these changes in place we can run our collector and Node.js server to see the end to end implementation working in all its glory. I would recommend opening two separate terminals and laying them out side-by-side.

In the terminal for the Python collector start the data harvest using the command python collector.py. On your PI you should see regular temperature updates on the matrix display.
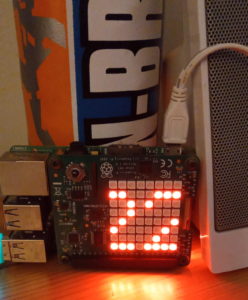
Raspberry PI Weather Station
Weather station running in the Raspberry PI

In the second terminal ensure you are in the collector/server directory and start the Node.js server using the command node index.js. If all is well you will see the message Listening on port 3000.
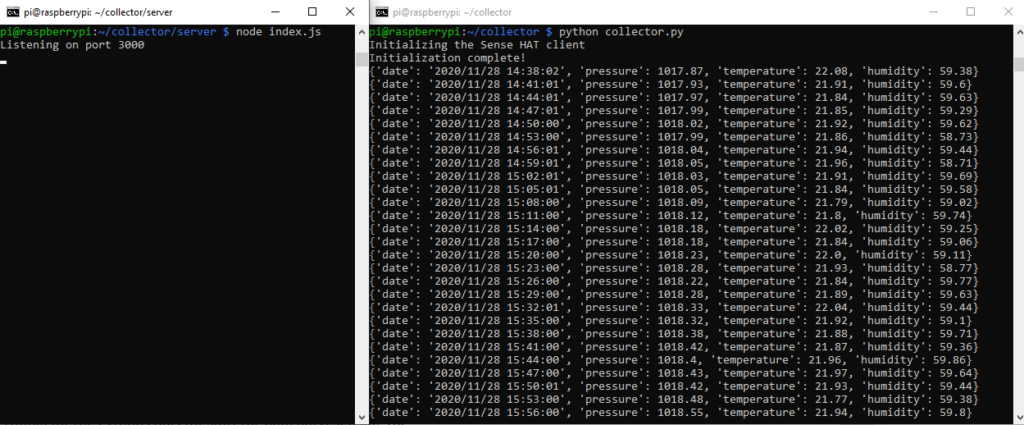
Terminal sessions running the collector and  Node.js server
Terminals sessions showing the collector and Node.js server running on the PI

After a while you will see entries printed in the server console indicating that the weather data has collected from the PI and sent it to our server.

Now comes the exciting bit. We can try out our new endpoints. Open a new browser tab and check the new endpoints are functioning correctly.

http://raspberrypi:3000/api/environment/entries

http://raspberrypi:3000/api/environment/meta
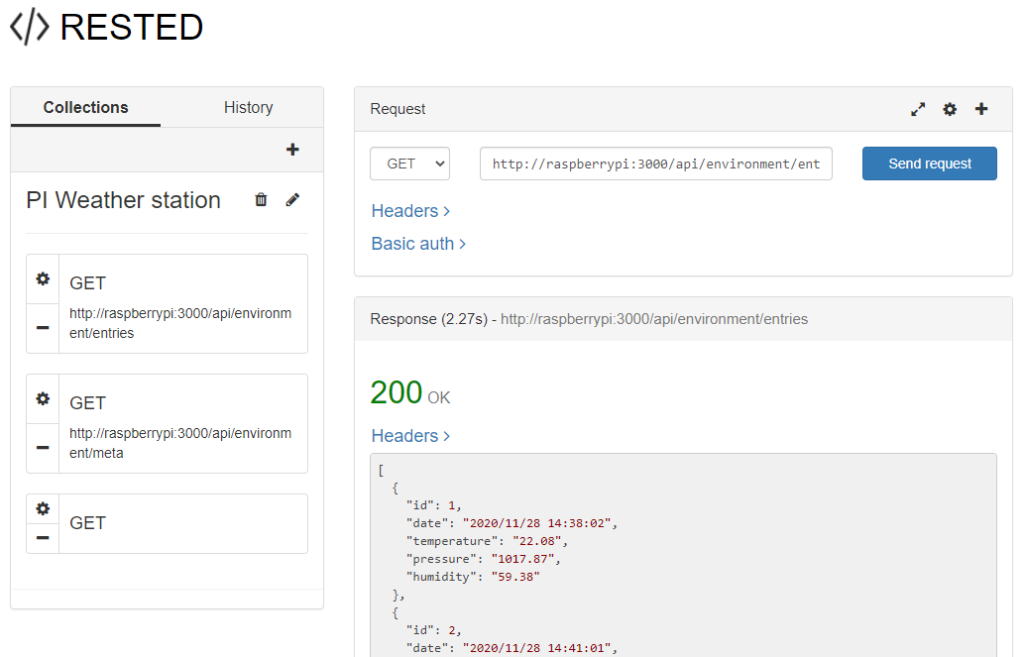
The new endpoints shown using the RESTED Chrome extension

All good? Great! What would be good is if we could somehow visualize our data in an attractive way. Well that’s the subject for the next and final instalment where we will be diving into the wonderful world of D3.

Easy as PI Weather Station – create a Node.js web service in 5 minutes

Introduction

In the last article we created a Python script to collect environmental data from a Sense Hat equipped Raspberry PI.

This article will add to that by creating a web service that will display all logged entries. In the next blog post we will add the ability to upload data from PI to the web service.

This web service will be running on the Raspberry PI but of course it could run anywhere as long as it supplies an endpoint to enable consumers to use it.

Building a RESTful API – do’s and do not’s

The web service will use RESTful principles. REST is a set of best practises to use when designing an API. In a nutshell:

  • DO return JSON
  • DO set the Content-Type header correctly i.e. application/json. Note, when using the PATCH method the content type must be application/merge-patch+json
  • DON’T use verbs e.g. use /songs instead of listSongs/
  • DO use plurals e.g. /api/songs/2019
  • DO return error details in the response body
  • DO make use of status codes when returning errors
    • 400-bad request, 403-forbidden, 404-not found, 401-unauthorised, 500 server error
  • For CRUD operation return the following codes
MethodDescriptionURLResponse code
GETretrieve dataapi/customers200
POSTcreate dataapi/customers
{“name”:”jon”, “email”:”a@a.com”}
201
PUTupdate dataapi/customers/1
{“name”:”dave”,”email”:”b@a.com”}
200
DELETEdelete dataapi/customers/1204
PATCHupdate partial dataapi/customers/1
{“op”:”replace”,”path”:”/email”,”value”:”a@a.com”}]
204
REST method, actions and expected response codes.

Defining the endpoints

Our API will have three endpoints. This article is focussed on the first one, to list entries. The other two will be addressed in a later post.

/api/environment/entries – to list all entries

The resulting JSON will be something like this:

[
    {
        "id":1,
        "date":"2020/06/06 15:34:01",
        "temperature":"24.48",
        "pressure":"998.32",
        "humidity":"44.9"
    }
]

/api/environment/ – to create a new entry

/api/environment/meta – to retrieve metadata such as number of entries, average temperature and last entry that was uploaded

Creating the web service using Express

Let’s get started! Connect your PI to the network either wirelessly or using a cable. I use an Ethernet cable directly plugged it into my laptop.

  1. Power up your PI!
  2. SSH into your PI. I used PuTTY
  3. Navigate to the collector directory we created the last blog post.
  4. mkdir server
  5. cd server

We are going to use Node.js to create our server. Node.js is based on the Chrome V8 Javascript engine but has added modules to deal with IO, HTTP and many more. It is basically a Javascript engine wrapped in a C++ exe. It has a single-threaded handler which hands off requests in an asynchronous manner so it is very suitable to quick high-throughput requests.

Out of the box it is very easy to create a simple REST API. We will be using another node module called express which makes managing routing much easier.

So first things first if you haven’t already done so install node and npm on your PI. Here is a noice instructable showing how to do it.
https://www.instructables.com/id/Install-Nodejs-and-Npm-on-Raspberry-Pi/

When you have successfully installed node and npm return to the server directory we created earlier. Now we can install express which is a lightweight framework for creating REST APIs.
npm install express --save

Create a file called index.js using your editor of choice. I used nano.
nano index.js

Paste the following:

 // import the express module and create the express app
const express = require('express');
const app = express();

// install middleware that can encode the payload
app.use(express.urlencoded({extended:false})); 

// create an array to hold the environmental data
const data = []; 

// End points for the web service
//list entries
app.get('/api/environment/entries', (req,res) => {
    res.send(data); //Just send at empty array for now
} );

// create a web server, running on your port of choice or 3000
const port = process.env.PORT || 3000;
app.listen(port,() => {
    console.log(Listening on port ${port});
} );

This server will respond to HTTP GET requests at the /api/environment/entries endpoint listening on port 3000.

Start the node server
node index.js

Open your browser and go to
http://raspberrypi:3000/api/environment/entries

The result will not be very exciting as you will just see an empty array returned in the browser. However, give yourself a pat on the back. You have created your first fledgling web service!

Easy as PI Weather Station – collecting the data

I inherited a Raspberry PI from a work colleague. It was complete with the Astro PI Hat(now known as the Sense Hat). This marvellous add-on gives a variety of environmental sensors such as temperature, humidity and air pressure.

For a while it sat there on the shelf dusty and forelorn. While doing some work in my shed I wondered whether I could use my PI to gather information and display it on the matrix display. I found a marvellous article on how to create a weather station by John M. Wargo. It is well worth a read. In the article, data is collected at regular intervals from the PI sensors and then uploaded to an external site hosted by weather underground. In no time I had a working weather station. I tweaked the script to show a line graph but it was a little janky because of the low resolution of the display.

Here is the PI in all its glory showing realtime temperature readings in graph form

In this post we are going to do something similar. We are going to collect data but upload it on our own server running a REST API. Then we are going to display this information on a lovely D3 chart. Wait! What? Yes, that is a lot to take in but fear not, this is going to be a 3 part post. The first part? Getting the data from the PI.

Let’s assume we have a fresh PI complete with an Astro Hat. Log in to your PI using puTTY or another application. I connect my PI direct to my laptop using an Ethernet cable but a wireless connection will work as well.

Now in your home directory(in my case /home/pi) create a new directory called collector

mkdir collector

Next use your editor of choice to create a file in the collector directory called collector.py. I use nano so in this case type nano collector.py.

Below is the code for collector.py. I ‘ll skip the first few functions. get_cpu_temp(), get_smooth() and get_temp(). These are used to try and get an accurate temperature reading because the Astro PI hat is affected by the heat given off y the PI CPU. These functions try and make allowances for that. Details here. If you can physically separate your PI using a ribbon cable then you can simply take the standard reading from the humidity sensor as detailed in the Sense Hat API.

#!/usr/bin/python
'''*******************************************************************************************************************************************
* This program collects environmental information from the sensors in the Astro PI hat and uploads the data to a server at regular intervals *
*******************************************************************************************************************************************'''
from __future__ import print_function
import datetime
import os
import sys
import time
import urllib
import urllib2
from sense_hat import SenseHat
# ============================================================================
# Constants
# ============================================================================
# specifies how often to measure values from the Sense HAT (in minutes)
MEASUREMENT_INTERVAL = 5 # minutes
def get_cpu_temp():
    # 'borrowed' from https://www.raspberrypi.org/forums/viewtopic.php?f=104&t=111457
    # executes a command at the OS to pull in the CPU temperature
    res = os.popen('vcgencmd measure_temp').readline()
    return float(res.replace("temp=", "").replace("'C\n", ""))
# use moving average to smooth readings
def get_smooth(x):
    # do we have the t object?
    if not hasattr(get_smooth, "t"):
        # then create it
        get_smooth.t = [x, x, x]
    # manage the rolling previous values
    get_smooth.t[2] = get_smooth.t[1]
    get_smooth.t[1] = get_smooth.t[0]
    get_smooth.t[0] = x
    # average the three last temperatures
    xs = (get_smooth.t[0] + get_smooth.t[1] + get_smooth.t[2]) / 3
    return xs
def get_temp():
    # ====================================================================
    # Unfortunately, getting an accurate temperature reading from the
    # Sense HAT is improbable, see here:
    # https://www.raspberrypi.org/forums/viewtopic.php?f=104&t=111457
    # so we'll have to do some approximation of the actual temp
    # taking CPU temp into account. The Pi foundation recommended
    # using the following:
    # http://yaab-arduino.blogspot.co.uk/2016/08/accurate-temperature-reading-sensehat.html
    # ====================================================================
    # First, get temp readings from both sensors
    t1 = sense.get_temperature_from_humidity()
    t2 = sense.get_temperature_from_pressure()
    # t becomes the average of the temperatures from both sensors
    t = (t1 + t2) / 2
    # Now, grab the CPU temperature
    t_cpu = get_cpu_temp()
    # Calculate the 'real' temperature compensating for CPU heating
    t_corr = t - ((t_cpu - t) / 1.5)
    # Finally, average out that value across the last three readings
    t_corr = get_smooth(t_corr)
    # convoluted, right?
    # Return the calculated temperature
    return t_corr

The main meat is in the, erm, main() function. Here we set up a loop to poll the PI at regular intervals, every 5 seconds so that the smoothing algorithm works effectively. The data is sent to the web service every 5 minutes. This is specified in the global variable MEASUREMENT_INTERVAL.

def main():
    global last_temp
    sense.clear()
    last_minute = datetime.datetime.now().minute;
    minute_count = 0;
    # infinite loop to continuously check weather values
    while True:
        dt = datetime.datetime.now()
        current_minute = dt.minute;
        temp_c = get_temp();
        # The temp measurement smoothing algorithm's accuracy is based
        # on frequent measurements, so we'll take measurements every 5 seconds
        # but only upload on measurement_interval
        current_second = dt.second
        # are we at the top of the minute or at a 5 second interval?
        if (current_second == 0) or ((current_second % 5) == 0):
            message = "{}C".format(int(temp_c));
            sense.show_message(message, text_colour=[255, 0, 0])
        if current_minute != last_minute:
            minute_count +=1
        if minute_count == MEASUREMENT_INTERVAL:
            print('Logging data from the PI')
            payload = {
                'date':dt.strftime("%Y/%m/%d %H:%M:%S"),
                'temperature':round(temp_c,2),
                'pressure':round(sense.get_pressure(),2),
                'humidity':round(sense.get_humidity(),2),
            }
            print(payload)
            # TODO post the results to our server
            minute_count = 0;
        last_minute = current_minute
        # wait a second then check again
        time.sleep(2)  # this should never happen since the above is an infinite loop
    print("Leaving main()")
# ============================================================================
# initialize the Sense HAT object
# ============================================================================
try:
    print("Initializing the Sense HAT client")
    sense = SenseHat()
    sense.set_rotation(90)
except:
    print("Unable to initialize the Sense HAT library:", sys.exc_info()[0])
    sys.exit(1)
print("Initialization complete!")
# Now see what we're supposed to do next
if __name__ == "__main__":
    try:
        main()
    except KeyboardInterrupt:
        print("\nExiting application\n")
        sense.clear()
        sys.exit(0)

A JSON object is used to hold this data which will look something like this

{
    'date': '2020/05/26 14:01:00',
    'pressure': 1035.2,
    'temperature': 28.36,
    'humidity': 39.82
}

This will be used as the payload to our web service. More to follow in part 2…