Sorry it has taken me so long to continue with this series. There were little things that got in the way such as C*****19, and going through redundancy but lets put those little things aside and recap. Last time we created a web service using node Express which will be used to capture environmental data from our Raspberry PI Sense Hat.
In this article we are going to hook things up by sending the data collected from the Raspberry PI, to our web service. We will also be updating our endpoints to handle the data correctly. Let’s get started!
First of all open the collector.py file.
We are going to POST the data to our web service endpoint. Find the line where we are checking if we have reached the interval and replace it with the code shown here.
if minute_count == MEASUREMENT_INTERVAL:
    # Create the payload object
    payload = {
    'date':dt.strftime("%Y/%m/%d %H:%M:%S"),
    'temperature':round(temp_c,2),
    'pressure':round(sense.get_pressure(),2),
    'humidity':round(sense.get_humidity(),2),
    }
    data = urllib.urlencode(payload)
    request = urllib2.Request(END_POINT,data)
    response = urllib2.urlopen(request).read()
    print(payload)
    minute_count = 0;
We are using a couple of Python libraries called urllib and urllib2 to do the heavy lifting of encoding our payload and sending it across to our Node.js server.
All that is left is to add the new endpoint to our Node.js server to process the request and update the list to return an actual list of weather data. Exciting eh! Open up another terminal session and navigate to the server directory. Using your editor of choice open up the index.js file.
Update the endpoints as shown below.
// Provide service meta data
app.get('/api/environment/meta', (req,res) => {
    res.header("Access-Control-Allow-Origin", "*");
    res.send({
        averageTemp:averageTemp,
        count:data.length,
        lastEntry:lastEntry
    } );
} );

// List all entries
app.get('/api/environment/entries', (req,res) => {
    res.header("Access-Control-Allow-Origin", "*");
    res.send(data);
} );

app.post('/api/environment', (req,res) => {
    if (!isValid(req.body)) {
        res.status(400).send('Invalid request, required fields missing.');
        return;
    }
    const count = data.length + 1;
    const entry = {
        id:count,
        date:req.body.date,
        temperature:req.body.temperature,
        pressure:req.body.pressure,
        humidity:req.body.humidity
    }
    lastEntry = entry;
    total += parseFloat(req.body.temperature);
    averageTemp = total / count;
    data.push(entry);
    res.json(entry);
} );
You may recall last time we added a dummy /api/environment/entries endpoint which simply returned an empty array.
Let’s flesh this out. The endpoint is defined as a POST method which means data is sent as part of the body of the request. We validate that we do indeed have a body then update the count metric. We then build a JSON object by pulling out the parts of the request we are interested in. Finally we update the lastEntry variable, work out the average temperature to date before updating our list.
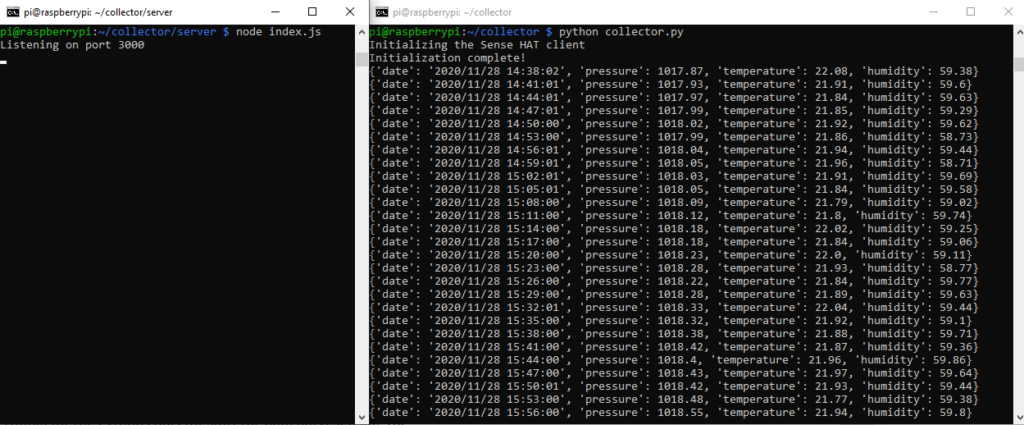
With these changes in place we can run our collector and Node.js server to see the end to end implementation working in all its glory. I would recommend opening two separate terminals and laying them out side-by-side.
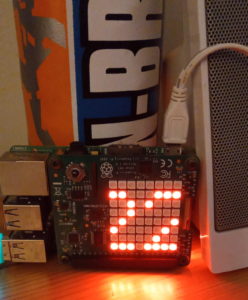
In the terminal for the Python collector start the data harvest using the command python collector.py. On your PI you should see regular temperature updates on the matrix display.

In the second terminal ensure you are in the collector/server directory and start the Node.js server using the command node index.js. If all is well you will see the message Listening on port 3000.

After a while you will see entries printed in the server console indicating that the weather data has collected from the PI and sent it to our server.
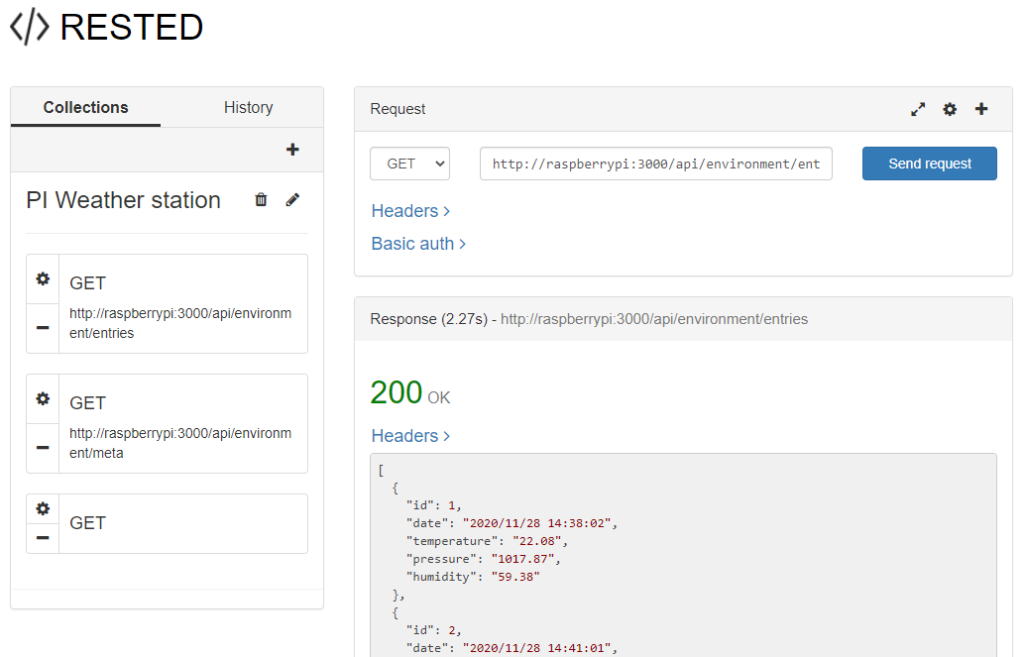
Now comes the exciting bit. We can try out our new endpoints. Open a new browser tab and check the new endpoints are functioning correctly.
http://raspberrypi:3000/api/environment/entries
http://raspberrypi:3000/api/environment/meta

All good? Great! What would be good is if we could somehow visualize our data in an attractive way. Well that’s the subject for the next and final instalment where we will be diving into the wonderful world of D3.
